
TrailingStop MultiTime
Quintalytics TrailingStop MultiTime For TradingView
This indicator is a combination of a Trend, Sideways/Chop Detection,
and Trailing Stop Loss indicator. This indicator is suitable for use in all timeframes and markets.
The Multiple time Frame function allows for the TrailingStop to be Calculated from another timeframe and shown in the current chart.
For Example:
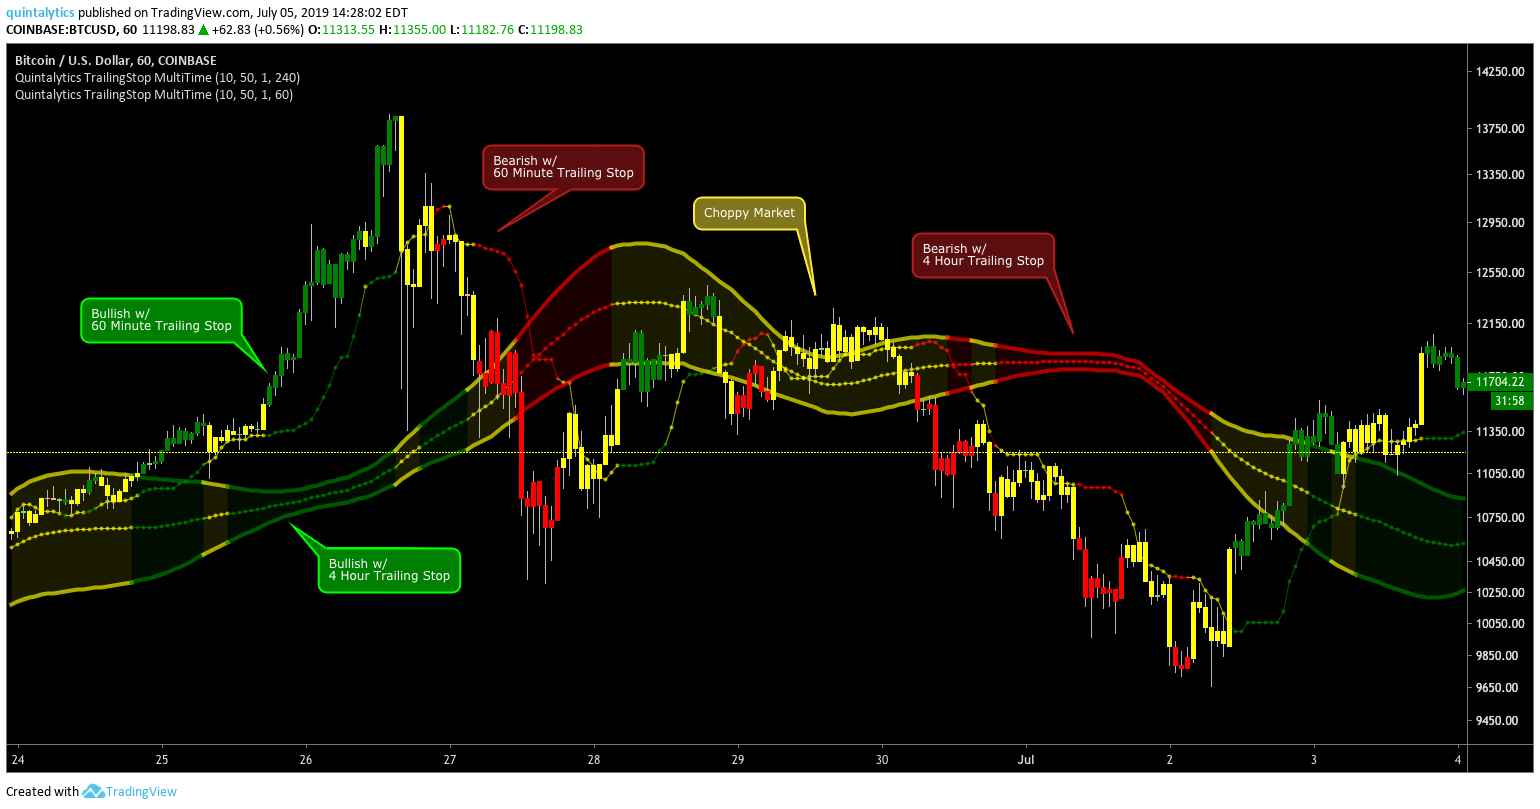
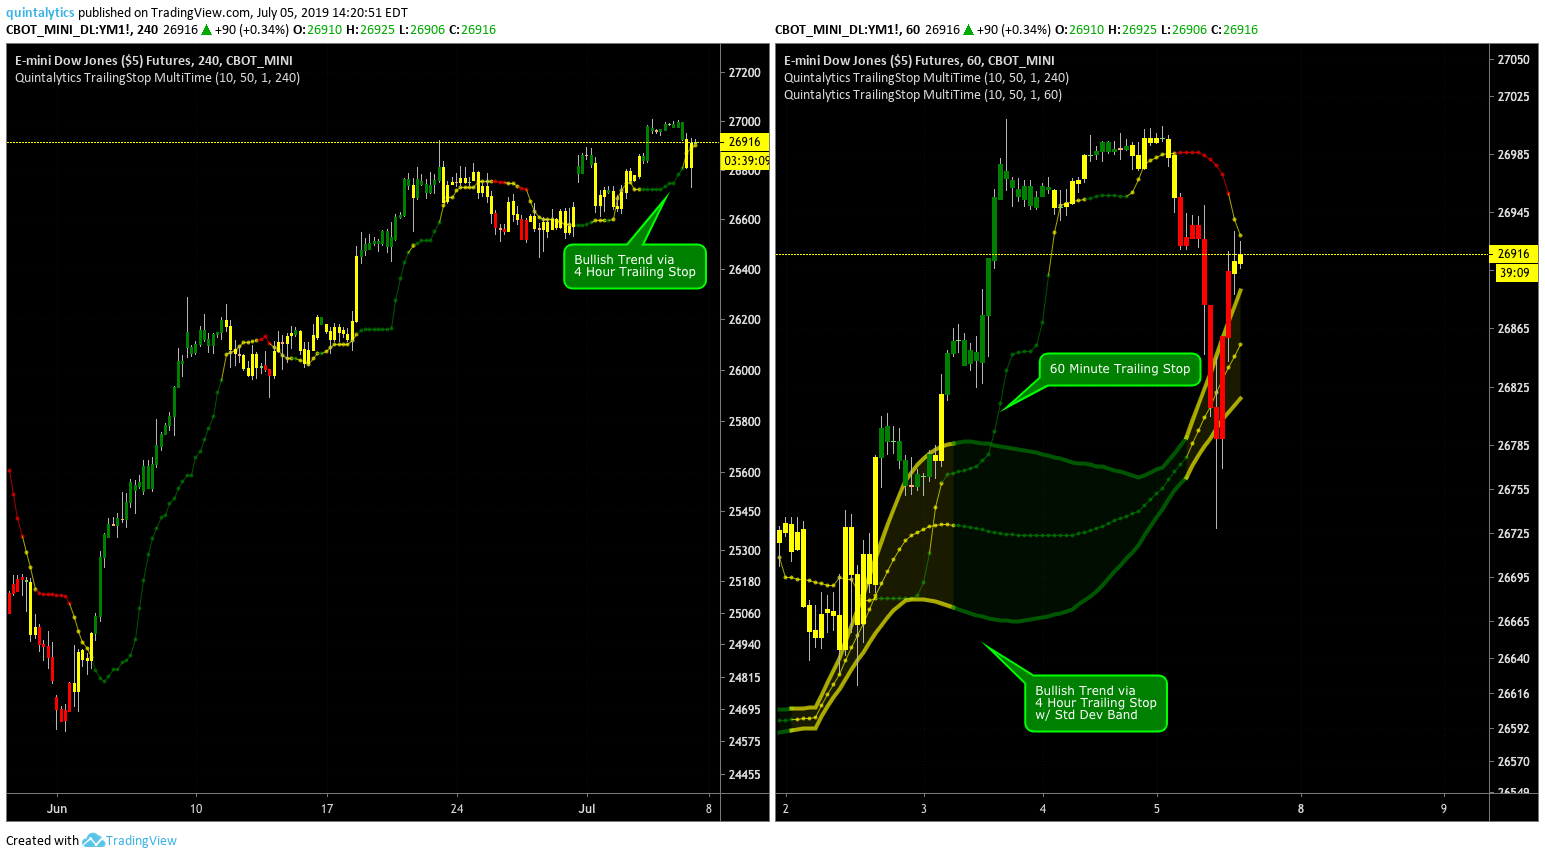
4 Hour TrailingStop line on a 60 Minute Chart
Daily Trailing Stop line on a 4 Hour Chart
15 Minute Trailing Stop line on a 5 Minute Chart
COLORS
The Color GREEN indicates the presence of a Bullish Trend.
The Color RED indicates the presence of a Bearish Trend.
The Color YELLOW indicates that the market is Sideways a.k.a. Flat a.k.a. Choppy.
You have the option of COLORING the BAR to match the Current TrailingStop color.
You have the option of applying a Smoothing to the TrailingStop line.
You have the option of showing a Standard Deviation Band based on the TrailingStop line.
SETTINGS
The indicator has seven parameters:
- Lookback – # of previous bars used to calculate the trailing stop
- Std Dev Lookback – # of previous bars used to calculate the Standard Deviation
- Std Dev X – Multiplier of Std dev. i.e. 2 = 2x Std Dev of the Trailing Stop line
- Color Bar? – toggle Coloring of the Candlestick/Bars on the chart
- Show Std Dev? – toggle showing the Std Dev bands.
- Smooth? – toggle Smoothing the Trailing Stop line
- Timeframe – Select the time frame used to calculate the Trailing Stop (1 Hour, 4 Hours, 1 Day, 1 Week, etc.)
Changing these settings individually or in combination will yield varying results.
2 Alerts are provided with the indicator: CLOSE OVER STOP line and CLOSE UNDER STOP line